Outputs
Last changes: Documentation changelog
Outputs turn solver results into inspectable scientific artifacts: fields and scalars, quantity selection, eigenmodes and spectra, dispersion and response, step snapshots, and autosave tables.
Control Room crosswalk
Inspect live and saved outputs across four coordinated Control Room surfaces:
Stage Autosave & Table Cadence (
Model Explorer -> Stages -> <stage> -> Autosave):AutosaveStageInspectorandTableAutosaveStageInspectormanage scalar and snapshot intervals for editable stages.2D Planar Field Map & Monitors (
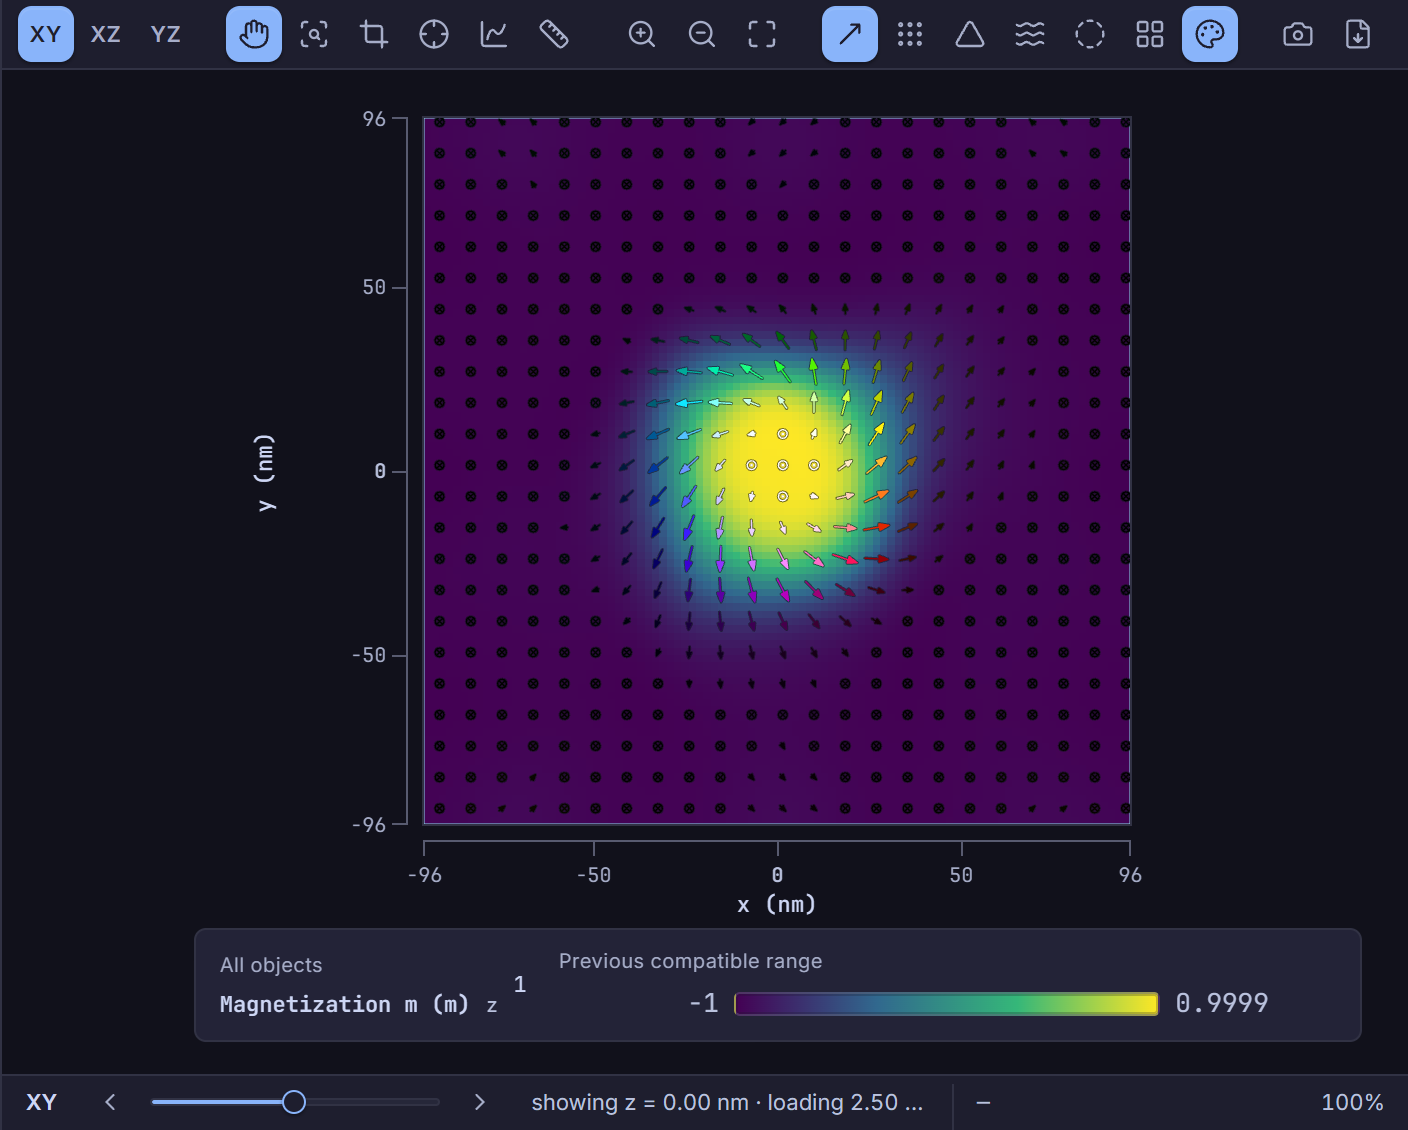
FieldMapModule,PlanarMonitorInspectorPanel): InteractiveXY/XZ/YZcross-sections, vector streamlines, contours, line-profile cuts, multi-layer overlays, and tiled multislice panels (PlanarMultisliceGrid).Live Charts & Spectral Analysis (
LiveChartsView,AnalysisPlotsView): FMTB-backed magnetization/energy curves, \(M(B)\) hysteresis loops, dynamic structure factor \(S(k,f)\) heatmaps, and FMR spectra.Saved Results Navigator (
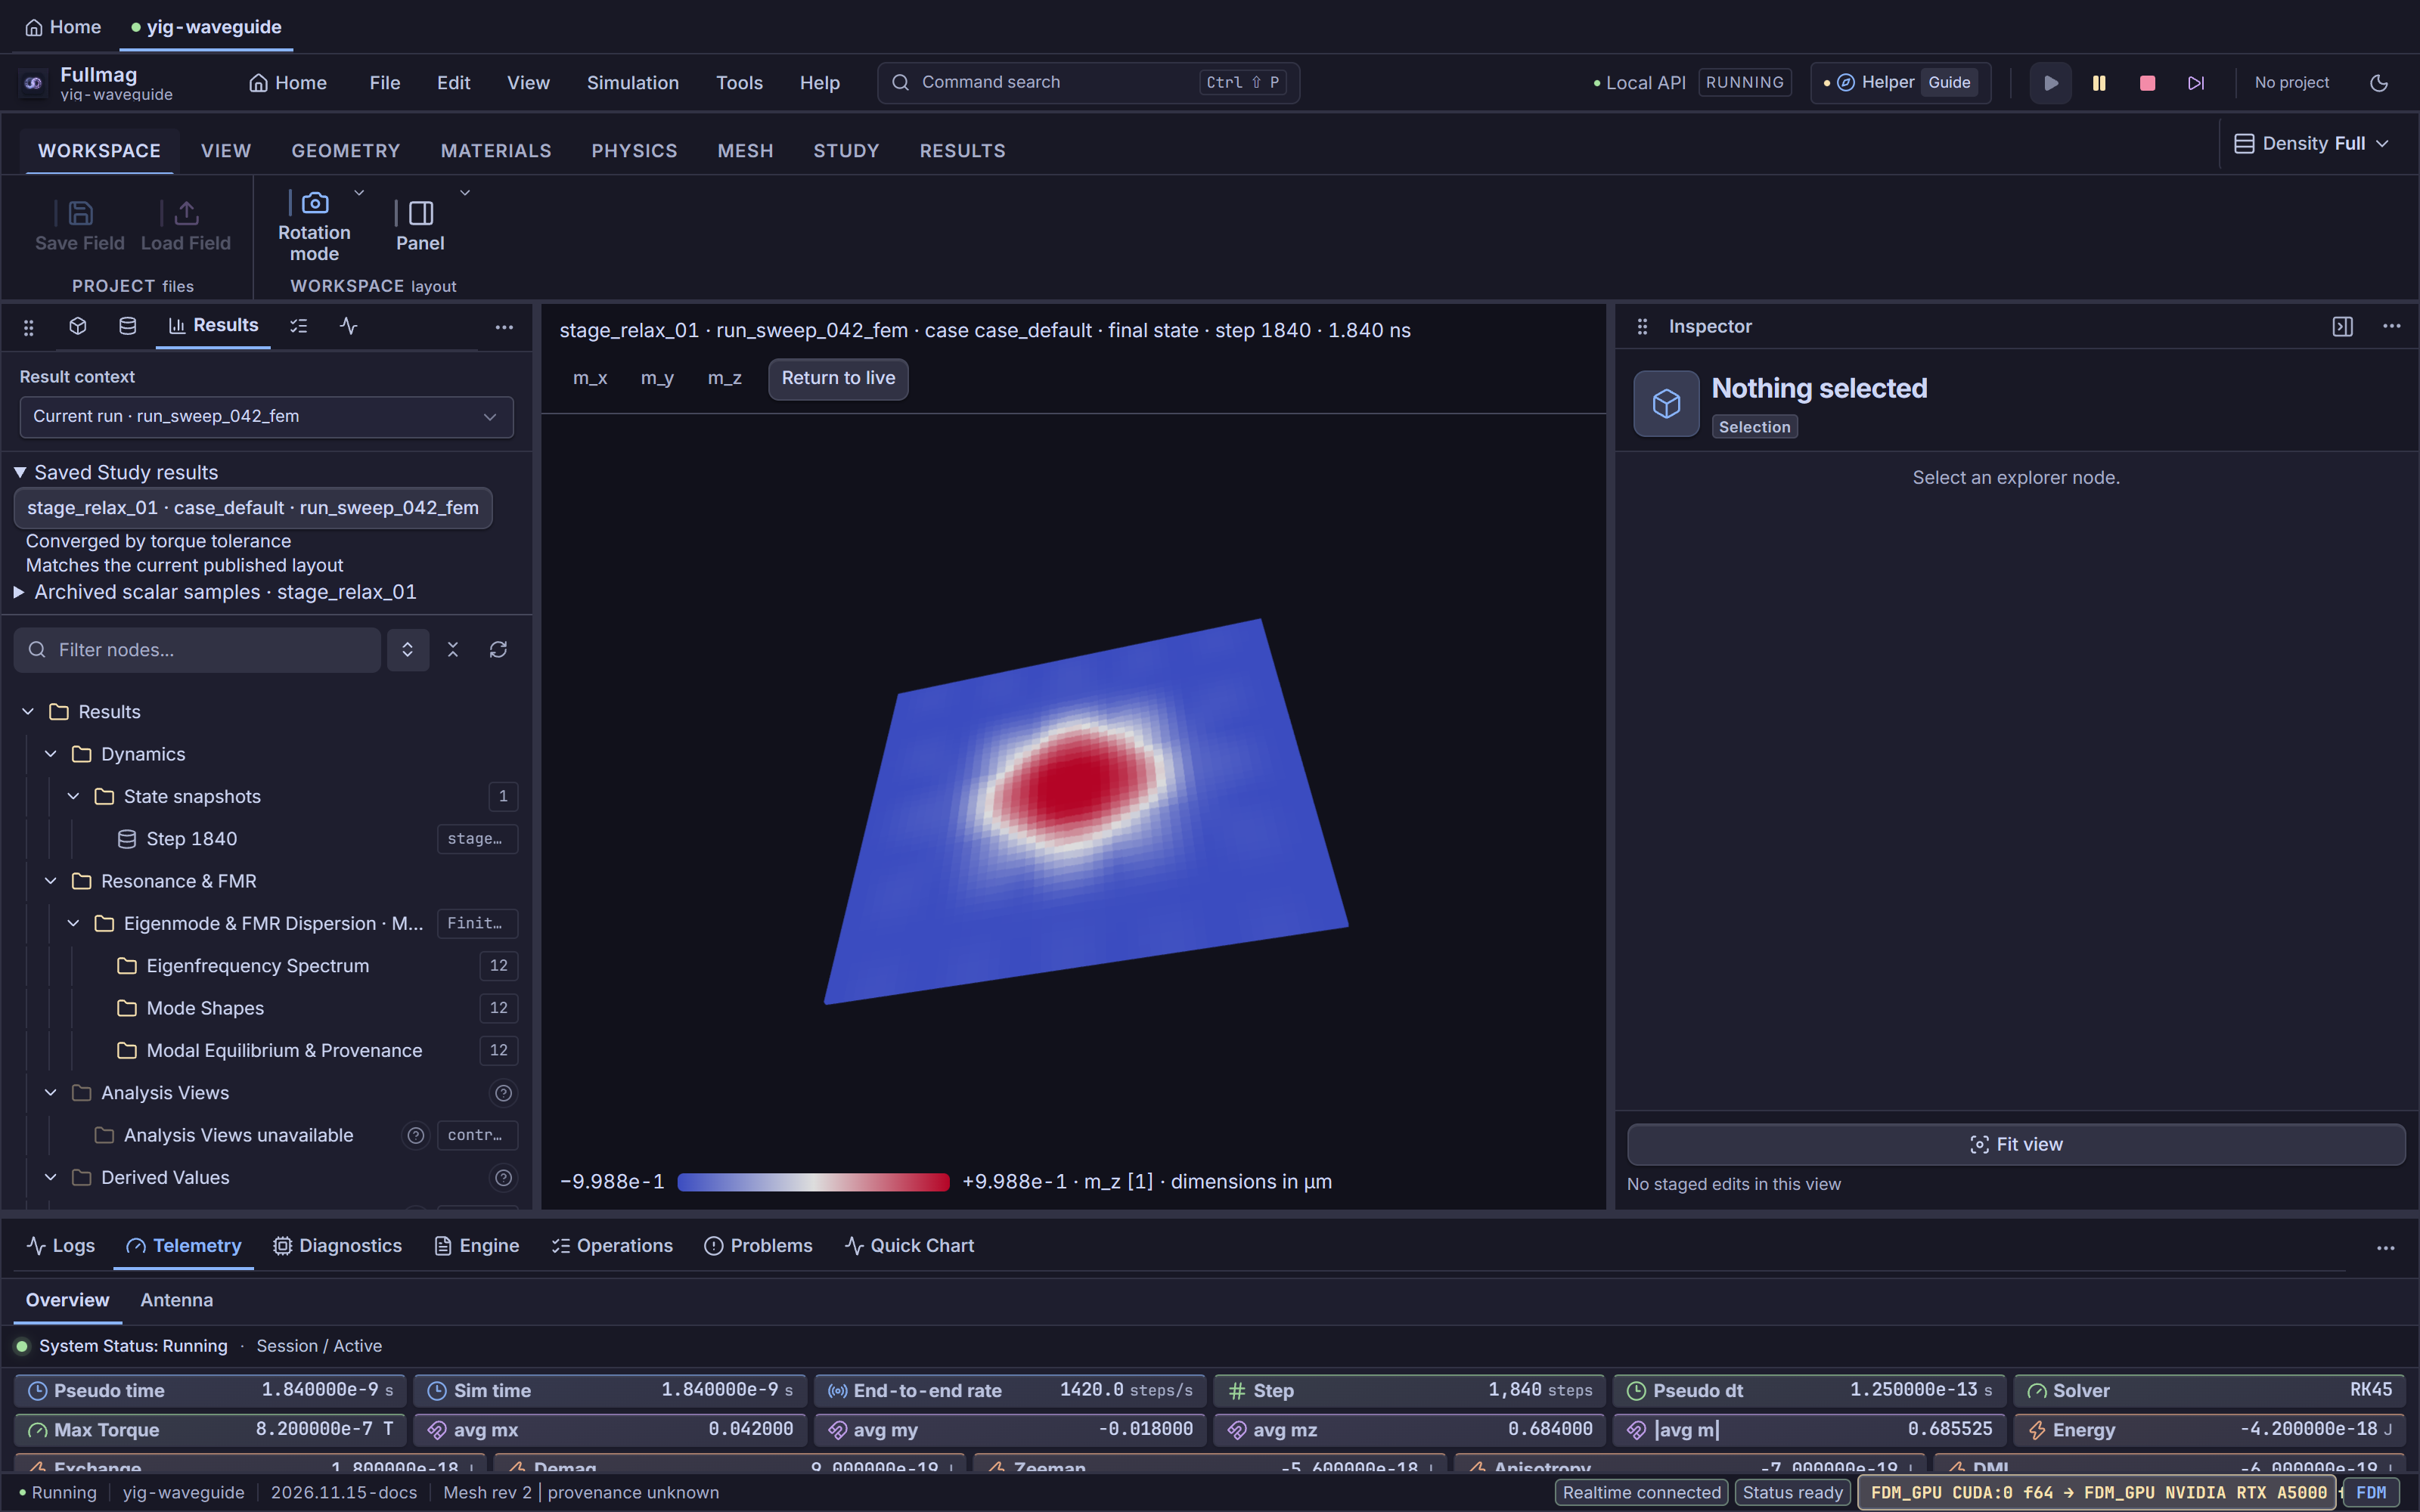
SavedResultsBrowser): Browse durableSolutionSetruns, scrub snapshots offline, and compare historical runs side by side.
Output formats or sampling rules without a matching inspector control are TODO: frontend support; this index does not imply that every publication artifact is authorable in the UI. See Control Room capability register, 2D Planar Field Map, Layers & Section Tools, and Live Charts, Hysteresis, Spectral Plots & Playback.
API and source scope
This navigation page has no standalone output function. Terminal pages own exact Python calls, artifact semantics, limitations, bibliography, and source-code indexes.
Source-code index
This is a navigation page and introduces no standalone implementation symbol. The exact source-code index is maintained by the selected terminal page.