Live Charts, Hysteresis, Spectral Plots & Playback
Last changes: Documentation changelog
Control Room v2 unifies time-series monitoring, hysteresis curves, dynamic structure factor
heatmaps, spin-wave / FMR spectra, and saved multi-run comparison across dedicated analysis modules
backed by ECharts (EChartsSurface.tsx), binary table streaming (FMTB), and durable
SolutionSet artifact indices.
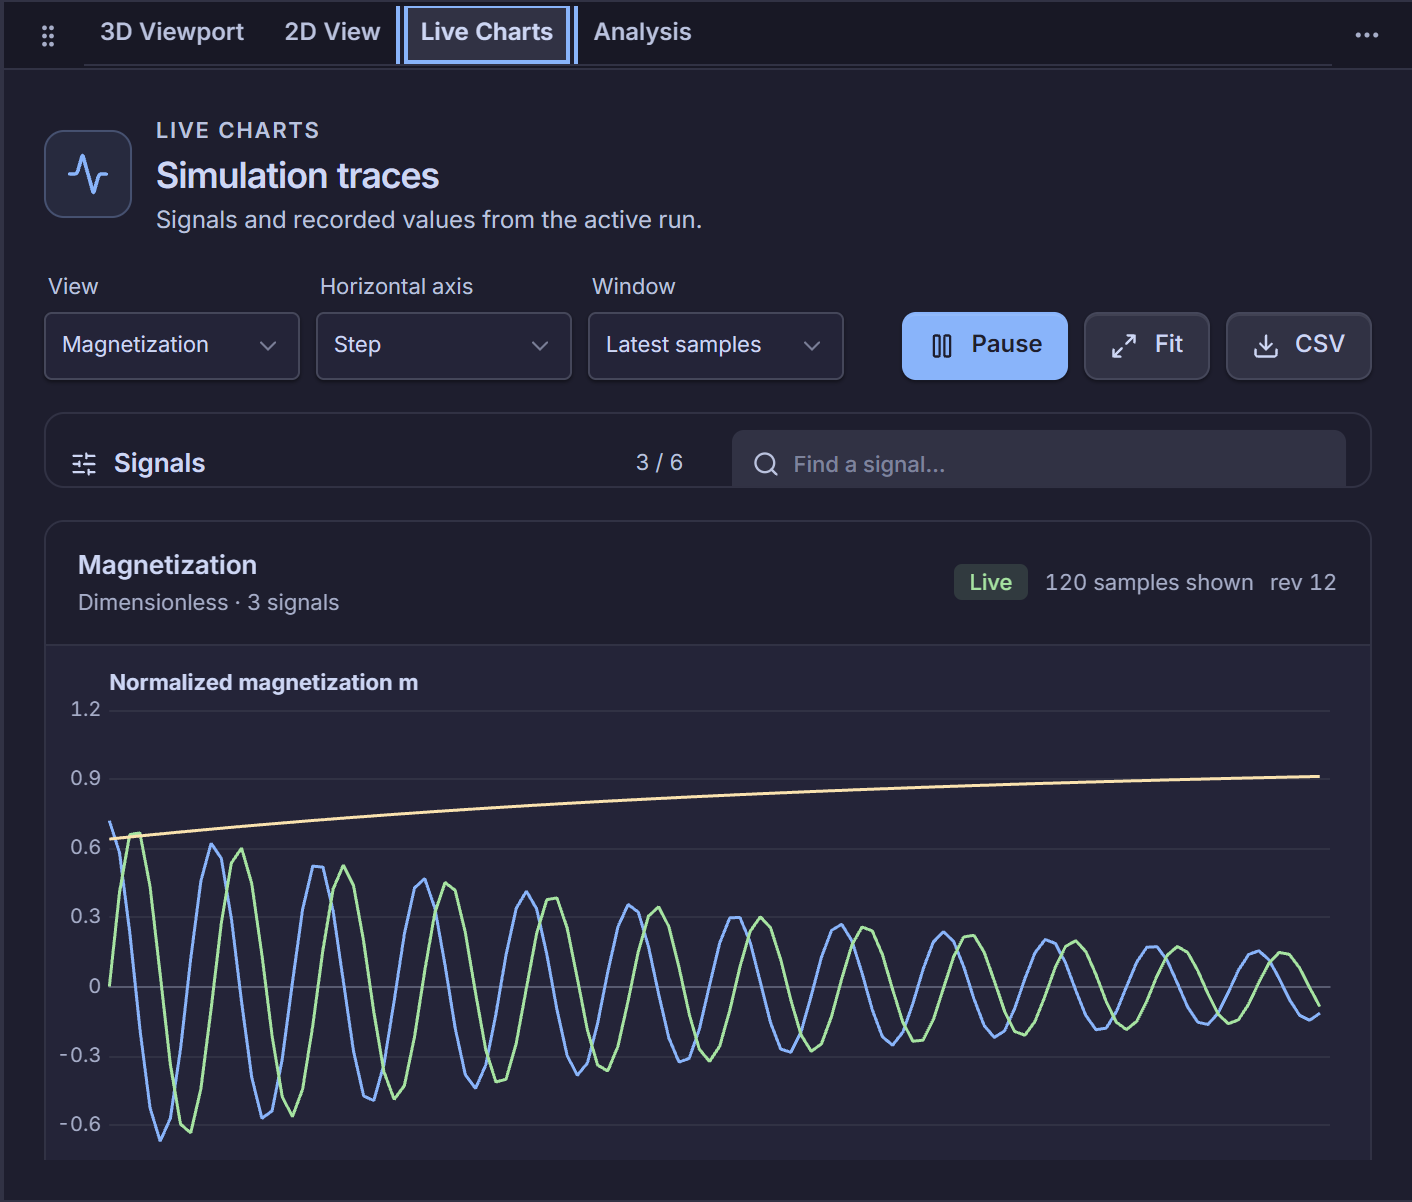
Live Simulation Traces (LiveChartsModule)
LiveChartsModule and LiveChartsView (apps/control-room/src/modules/live-charts/) plot
real-time and completed table columns with responsive decimation and CSV export:
Presets (
LiveChartControls): Switch cleanly betweenMagnetization,Energy,Convergence, andCustomseries selections.Axes & Sampling Windows: Choose the horizontal axis (
xAxisOptions) and sample window (Latest samplesfollow mode vs.Last 5,000 samples (decimated)).Follow / Pause / Fit / CSV Export: Pausing
Followfreezes the viewport window for zoom inspection without interrupting the running backend simulation; CSV downloads the visible sampled signals.
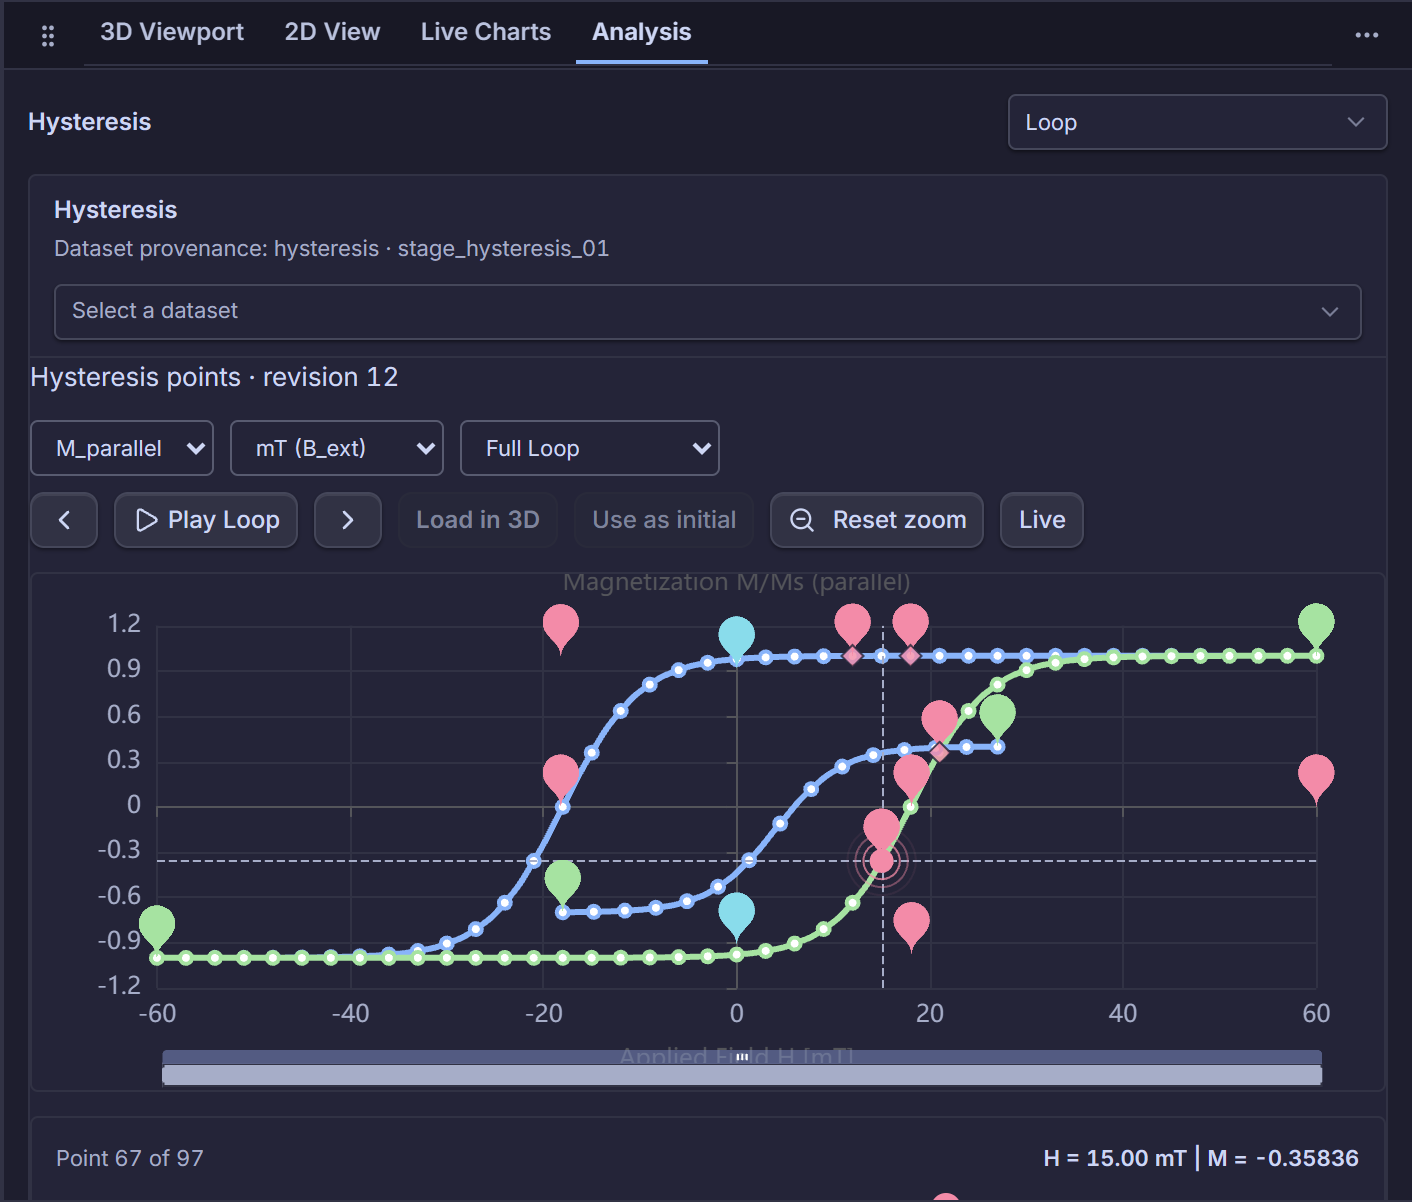
Hysteresis Loops and Snapshot Replay (analysis-hysteresis, HysteresisChart)
Rendered inside AnalysisPlotsView (apps/control-room/src/modules/analysis-plots/AnalysisPlotsView.tsx),
hysteresis curves plot macroscopic \(M(B)\) branches with bidirectional cursor synchronization: clicking
any field step along the ascending or descending branch updates global Selection (stageId,
snapshotId, field_value_mT, branch_id), allowing PlanarSnapshotNavigator (2D) and
HysteresisReplayGlyphLayer / Viewport3DModule (3D) to replay the spatial magnetization state at
that exact bias field.
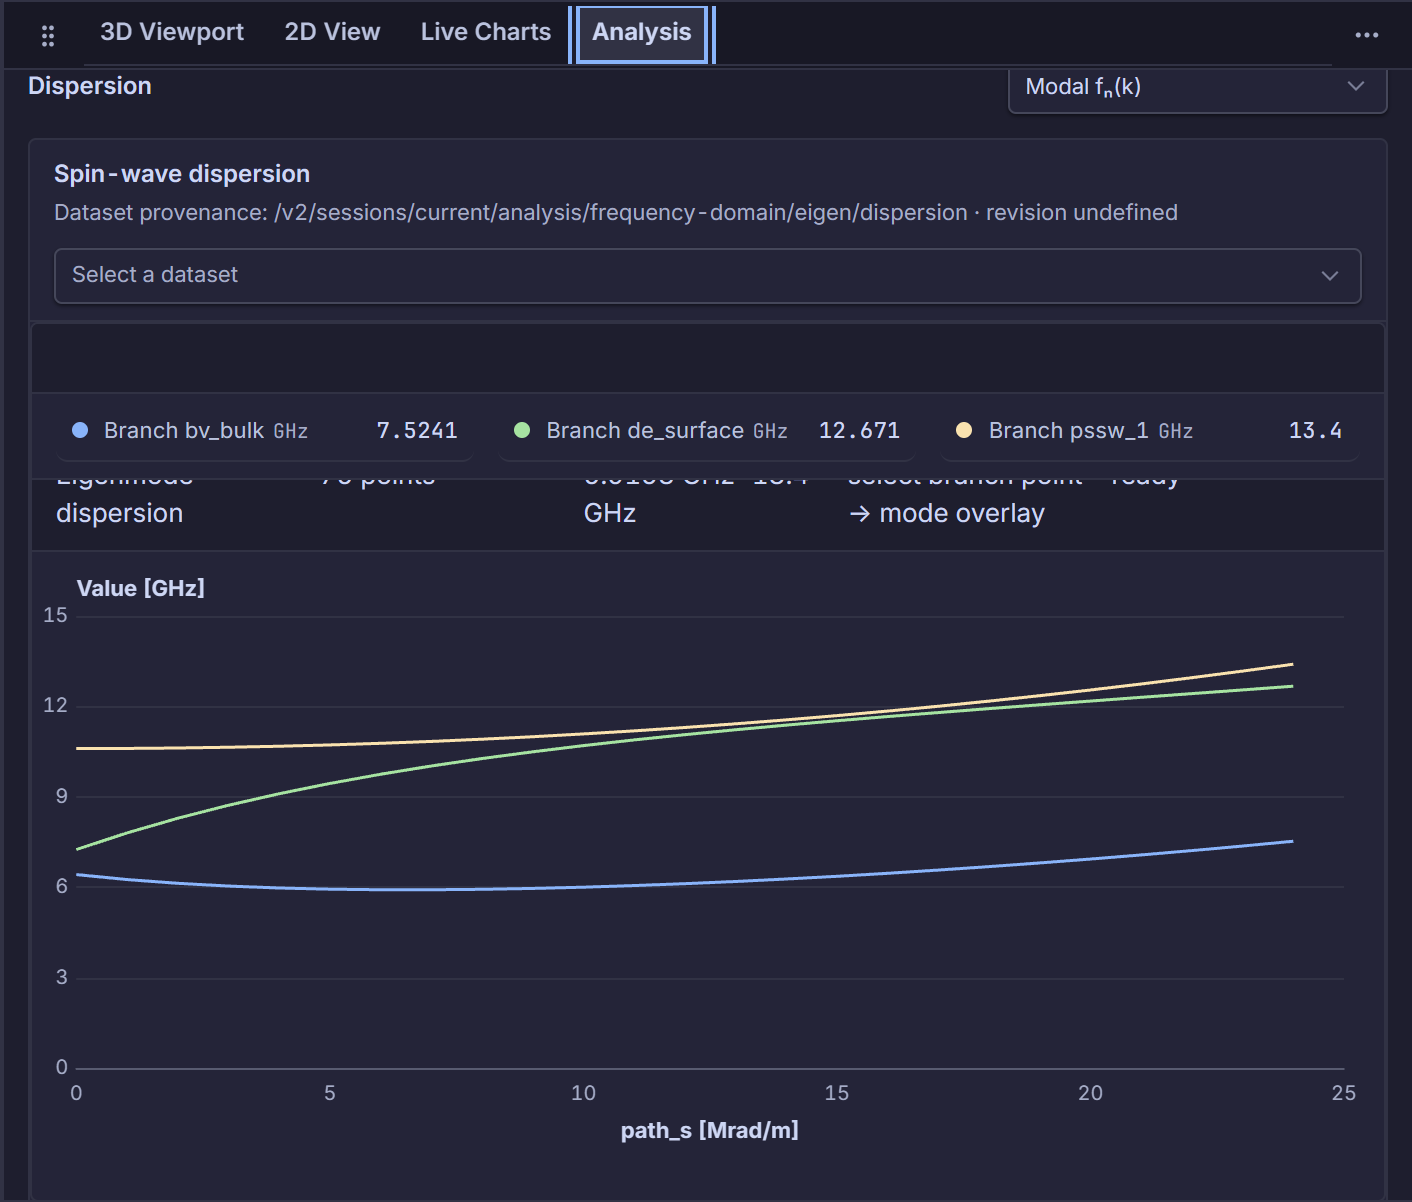
Spectral Dispersion, \(S(k,f)\), and FMR Plots (AnalysisPlotsView)
Frequency-domain and spin-wave post-processing surfaces share AnalysisPlotsView and specialized
domain views:
\(\Gamma\) Spin-Wave Response (
SpinWaveGammaView): Displays sampling metadata (\(N\), \(t_{\text{sampling}}\), duration, \(\Delta f\), Nyquist limit), response trace \(\Delta m(t)\), drive/antenna trace \(H(t)\), FFT spectra, and interactive spectral peak tables linking clicks back to frequency features.Dynamic Structure Factor \(S(k,f)\) (
DynamicStructureFactorView): Interactive keyboard-navigable heatmap (Log/Linearscale;S(k,f)response orH(k,f)source spectrum) paired with selectable horizontal f cut and vertical k cut slices. When the backend serves a bounded decimated heatmap, the view displays an explicit sampling notice so decimated projections are never mistaken for raw full payloads.Eigenmode Dispersion & Driven FMR Curves: Plots tracked magnon bands \(\omega(k)\) and absorbed power / susceptibility curves side by side with
EigenDispersionInspectorPanelandFmrResponseSweepInspectorPanel, enabling one-click spatial mode projection onto the 3D canvas.
Saved Results Navigator and Comparison (ResultsNavigatorModule, SavedResultsBrowser)
SavedResultsBrowser (apps/control-room/src/modules/results-navigator/SavedResultsBrowser.tsx)
and SavedResultsPlaybackViewport browse historical project runs, batches, and materialized
SolutionSet revisions (solutionSetResources.ts). Operators inspect paged scalar tables, open
materialized field snapshots (SavedMaterializedArtifactRow) offline, scrub recorded frame sequences,
and trigger overlaid result comparisons across selected datasets.
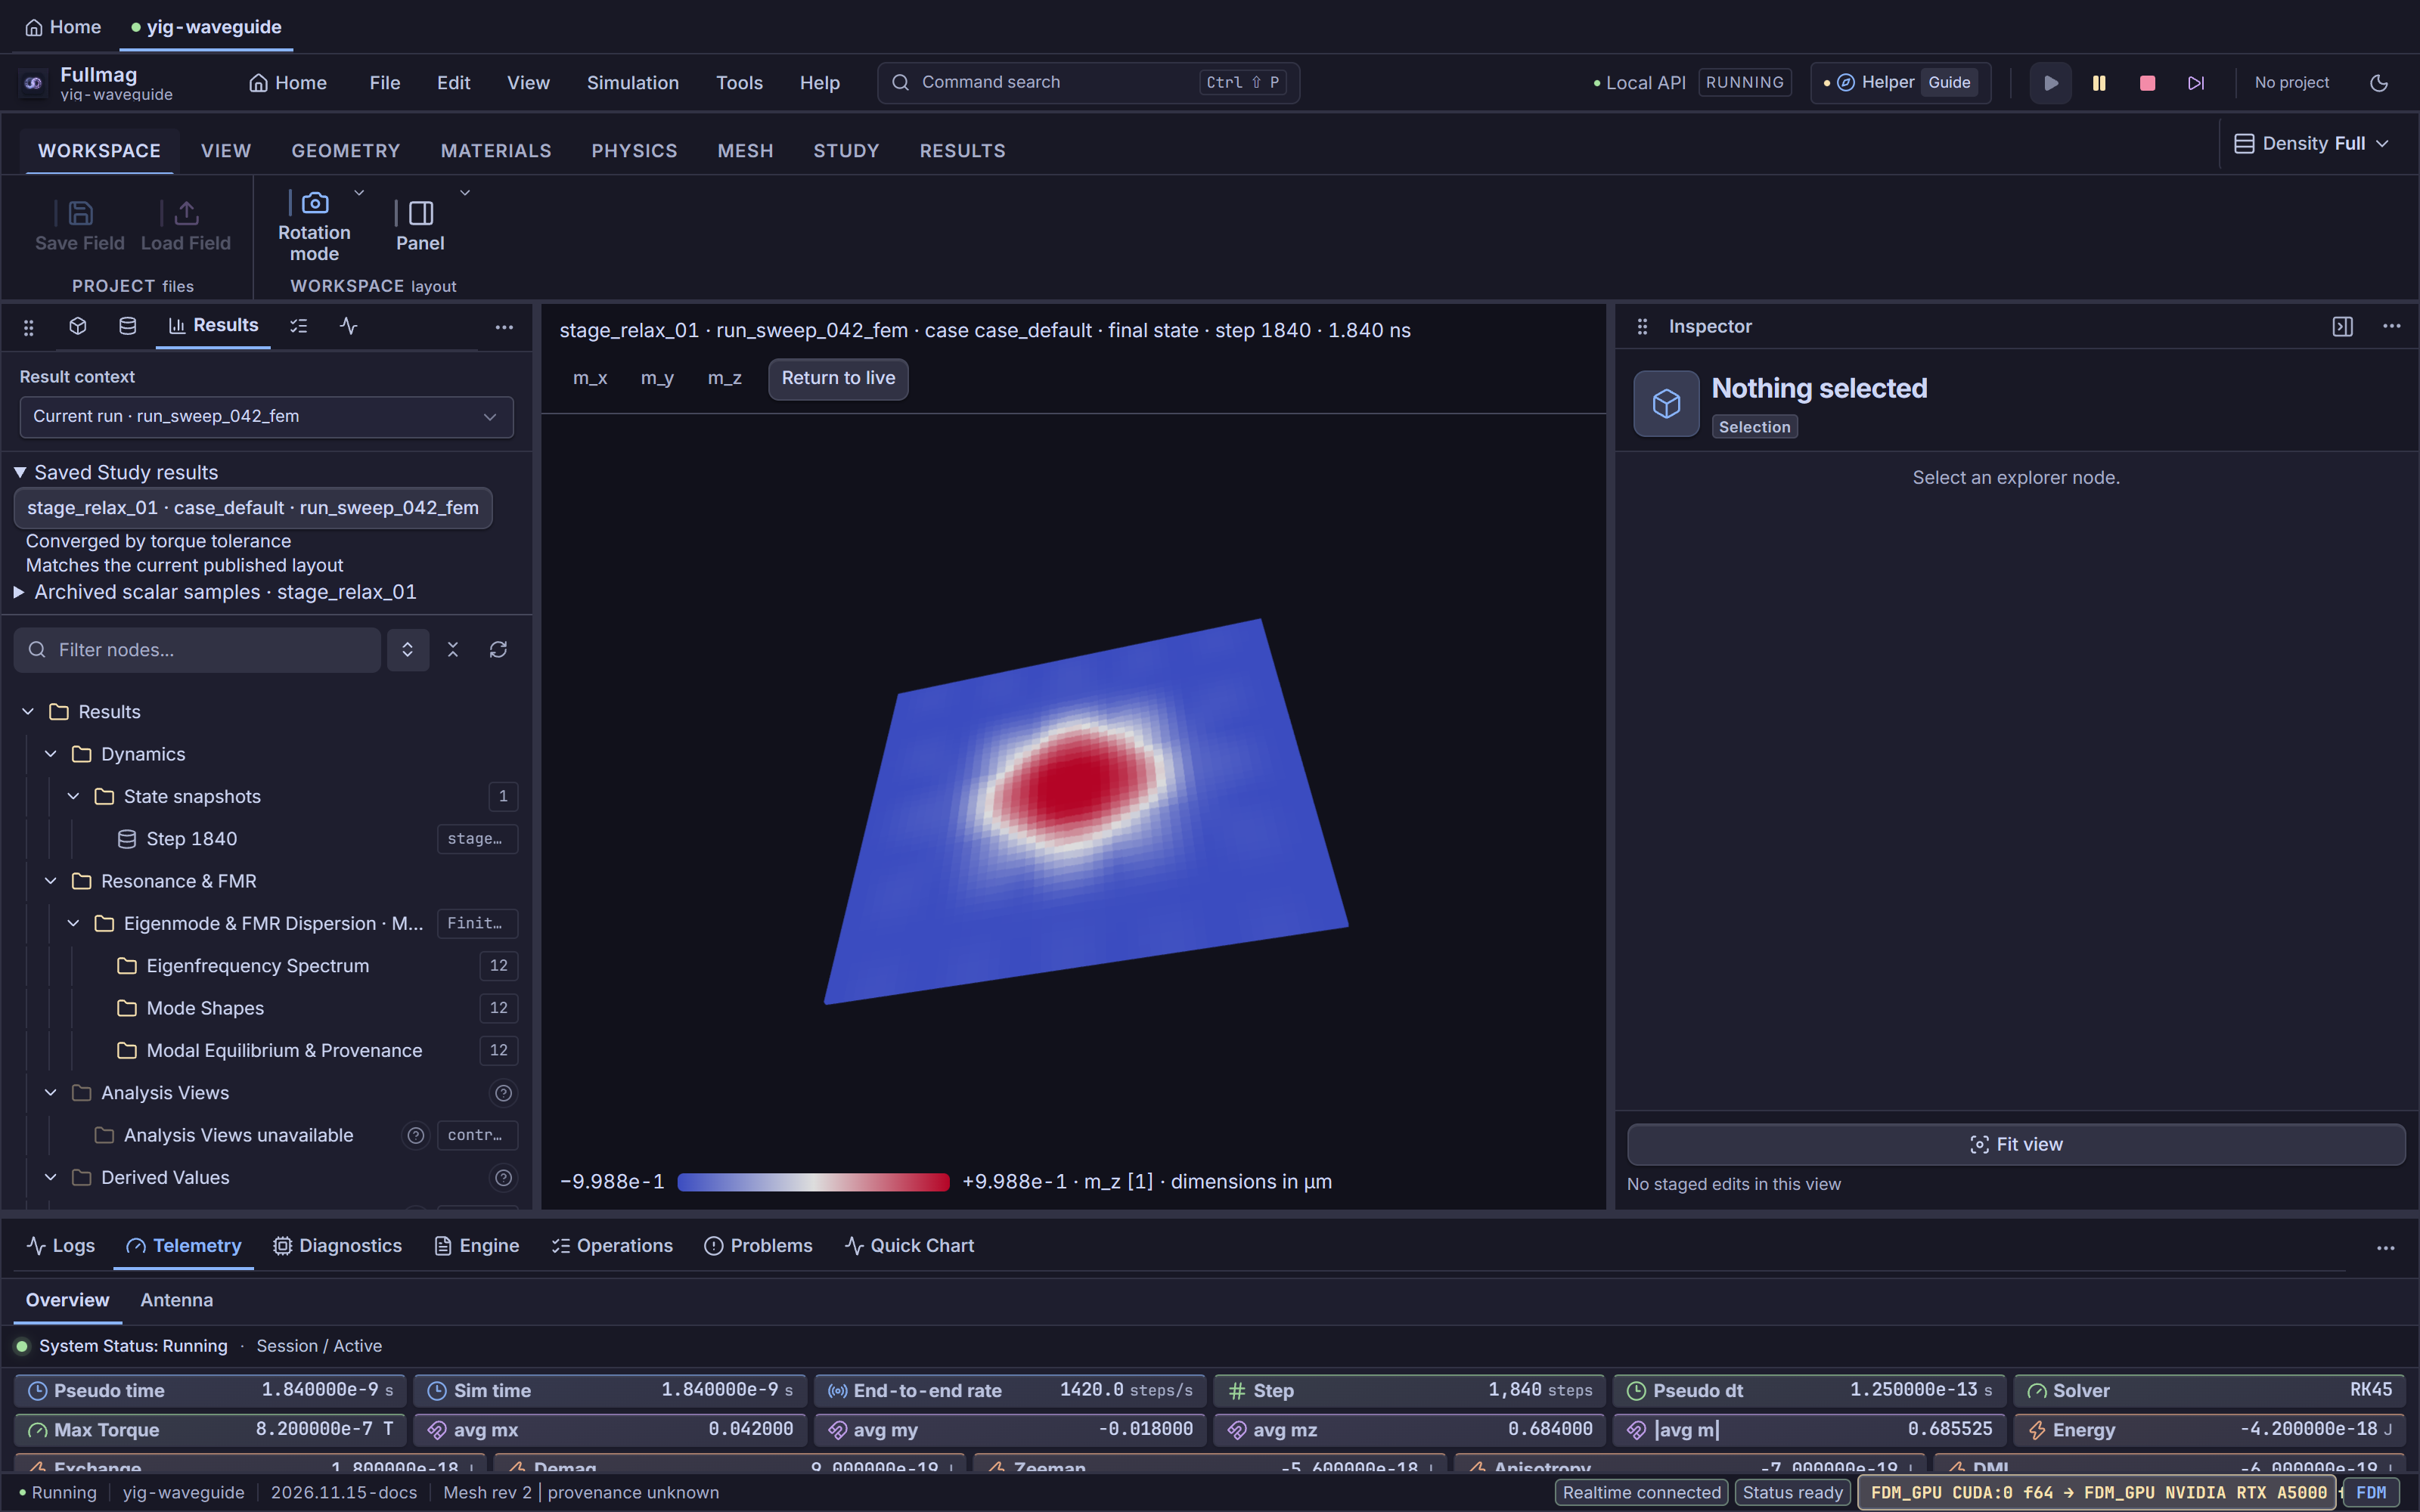
Screenshots illustrate the interface; they are not runtime or physics qualification evidence.
Control Room crosswalk
Modules:
LiveChartsModule,AnalysisPlotsModule,dispersionAnalysisModule,hysteresisAnalysisModule,resonanceAnalysisModule, andResultsNavigatorModule.Binary & paged data: Time/table traces stream over binary
FMTB(tableRowsCodec.ts) rather than unbounded JSON arrays; decimated projections disclose bounding in UI status chrome.
Python/API crosswalk
Plotted traces correspond to stage
table_autosave,autosave,hysteresis,fft_response,eigenmodes, andfrequency_responseartifacts in Python and saved.zarr/SolutionSetarchives.
Physics and bibliography scope
This page covers plotting surfaces, interactive peak/snapshot selection, and decimation indicators; mathematical definitions of \(S(k,f)\), linear susceptibility, and hysteresis schedules are documented in the numerical-methods guide.
Source-code index
Responsibility |
Repository path |
Stable symbol |
|---|---|---|
Live time-series module & controls |
|
|
Unified analysis plot container |
|
|
Dynamic structure factor \(S(k,f)\) heatmap |
|
|
Gamma FFT trace & peak table view |
|
|
ECharts lifecycle & SVG/PNG surface |
|
|
Saved SolutionSet browser & playback |
|
|