Planar Monitors, Dispersion & Frequency-Domain Inspectors
Last changes: Documentation changelog
Analysis and frequency-domain inspectors connect authored probe geometries, modal calculations,
response sweeps, and saved SolutionSet artifacts to interactive 2D and 3D visual overlays without
blurring authored definitions and realized outputs.
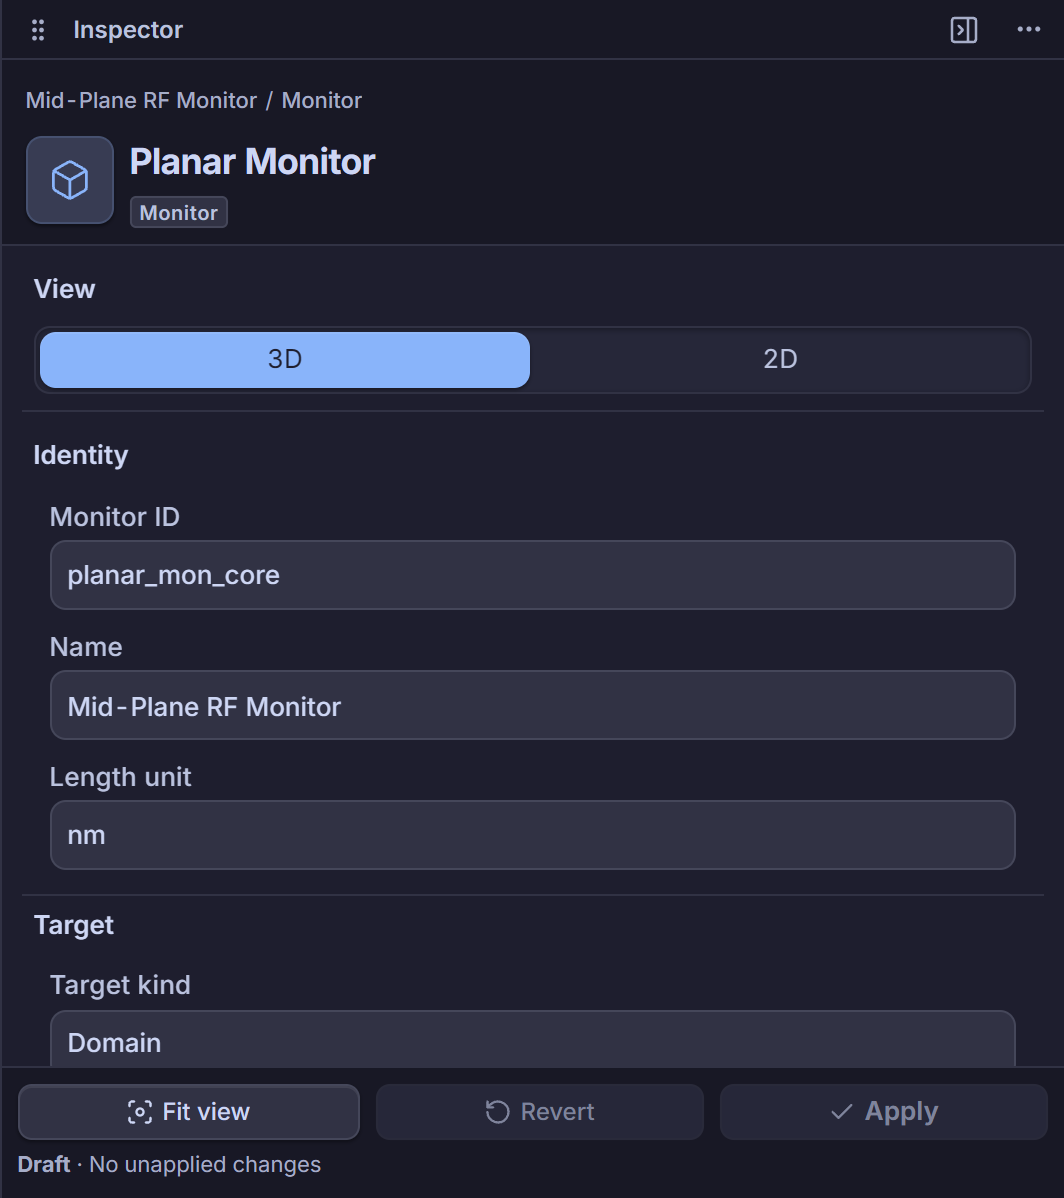
Planar Monitor Draft and Committed Editors
Draft Creation (
PlanarMonitorDraftInspectorPanel): Triggered from the Ribbon View -> Monitor action (RIBBON_CROSS_SECTION_BEGIN_DRAFT_COMMAND), allowing users to place a preview cut plane in 3D space (assisted byPlanarMonitorFacePicker,PlanarMonitorNormalHandle, andPlanarMonitorRotationRingsgizmos), checkplanarMonitorDefinitionAvailabilityErrorsand domain bounds, verifyscene_revisionuniqueness against existing monitors, and commit cleanly toMODEL_PLANAR_MONITORS_PATH.Committed Monitor Inspector (
PlanarMonitorInspectorPanel,PlanarMonitorDefinitionEditor): Edits plane center, normal, in-plane axes/extent, grid sampling resolution, and active 2D overlay layers (PlanarVisualizationSection,PlanarFieldLayerList), synchronizing camera/visualization focus viaVisualizationContextSwitch.Legacy Cross-Section Panel (
CrossSectionInspectorPanel): Inspects legacy cross-section cuts and associated quality profiles (CrossSectionQualityChart).
Frequency-Domain Inspectors (panels/frequency-domain/)
Spectral and modal analysis selections route to specialized InspectorOverviewFrame panels:
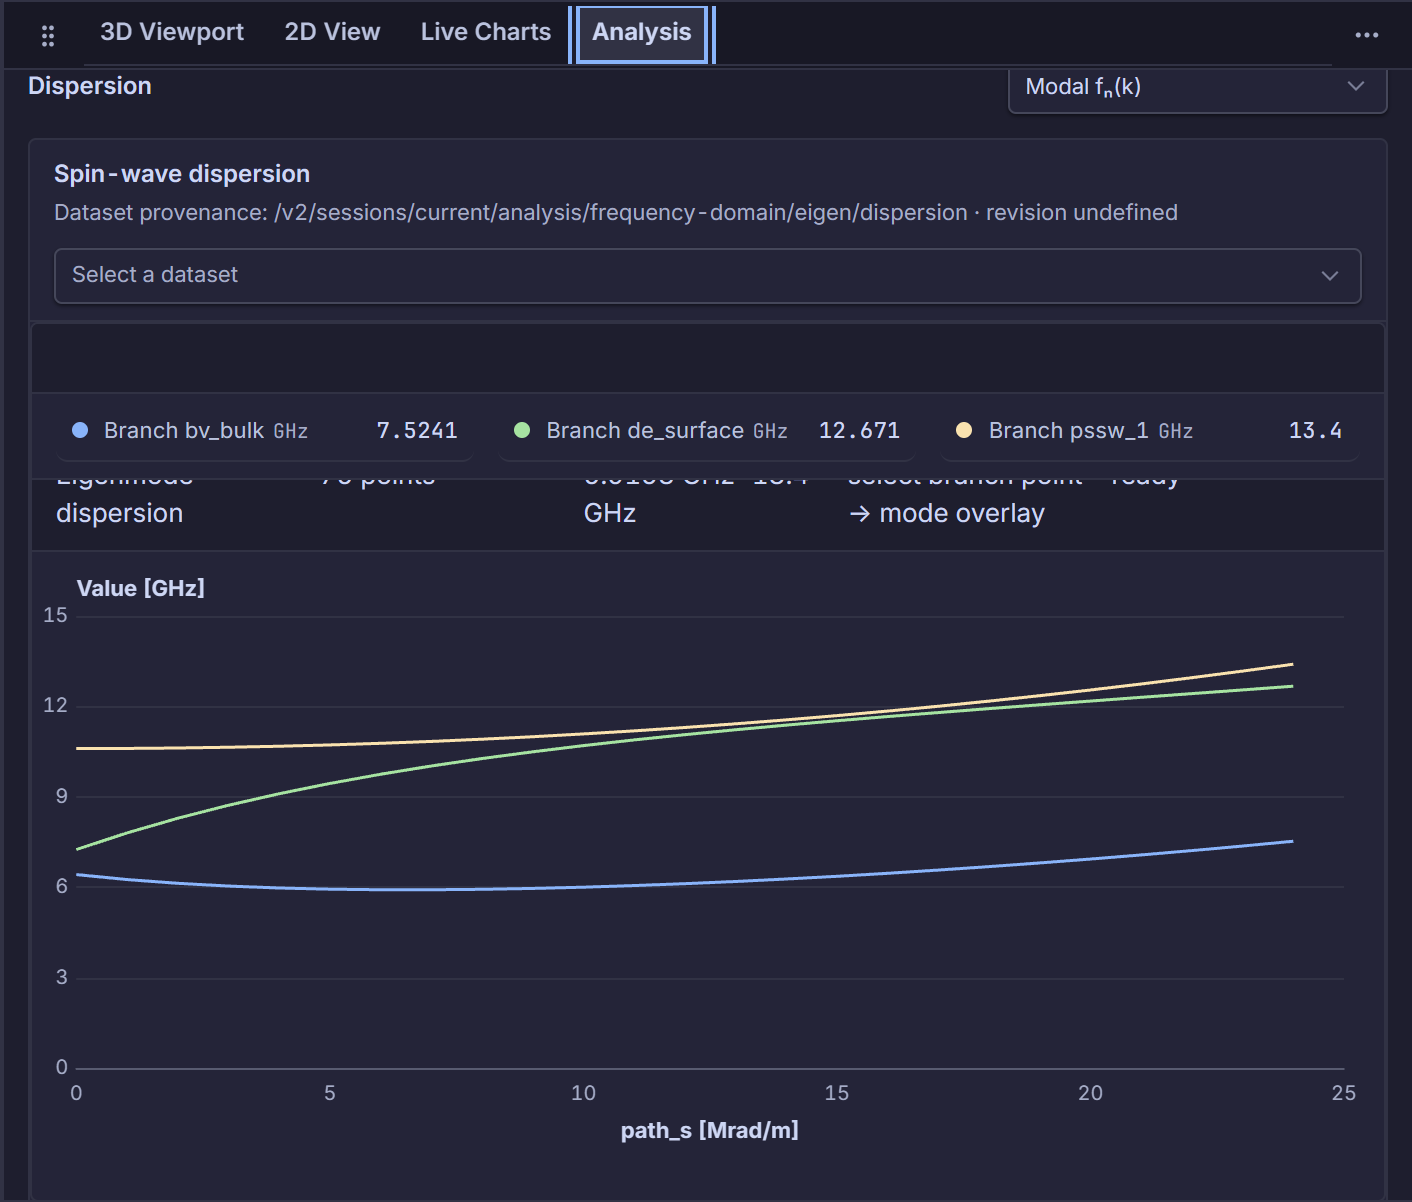
Eigenmode Dispersion (
EigenDispersionInspectorPanel): Displays point count, tracked branch count, reference comparison status (matchingvs. mismatch warnings), \(f\)-range, Bloch \(k\)-path span and symmetry labels, interactive dispersion plot (FrequencyDomainDispersionChart), and branch table (FrequencyDomainBranchTable). Selecting a point or branch updates selection focus cleanly across chart, explorer, and inspector.FMR Driven Response Sweep (
FmrResponseSweepInspectorPanel): Summarizes sweep progress (useFrequencyDomainResponseProgressResource), response points (FrequencyDomainResponseChart,FrequencyDomainResponsePointTable), and extracted resonance peaks (FrequencyDomainFmrPeakTable), with one-click actions to project a driven response field into 3D (analysis.frequency-response.plot-response-field-3d) or launch harmonic phase animation (analysis.frequency-domain.set-3d-animation).FMR Peak Detail (
FmrPeakInspector): Shows identity badge, frequency, physical source, canonical target, complex amplitude, absorbed power density, phase, linewidth, provenance, plot readiness diagnostics, and shared 3D display triggers.
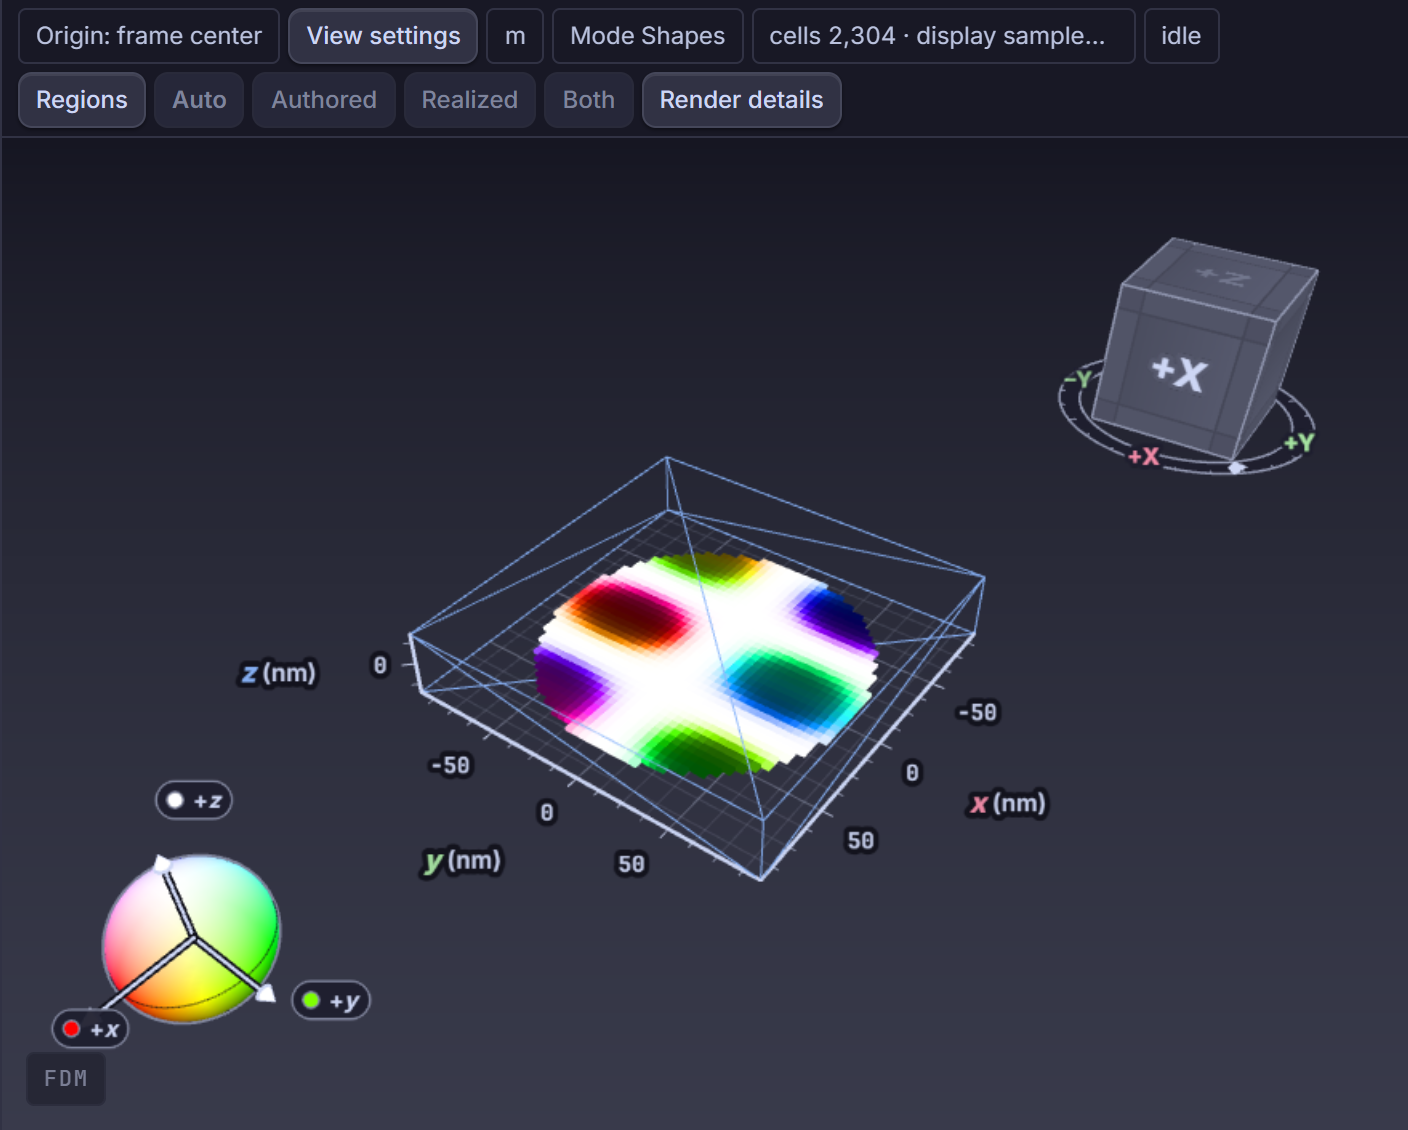
3D Mode & Spatial Profile Overlay Controls (ModeVisualizationInspectorPanel)
When plotting either a Bloch/FEM eigenmode (source: "eigen-mode") or a driven harmonic response
field (source: "frequency-response"), ModeVisualizationInspectorPanel exposes shared overlay
controls synchronized with the Ribbon’s contextual Analysis (analysis-context) tab:
View layout selector (
Chart,3D field,Chart + 3DviaVisualizationContextSwitch);Phase slider (
0to \(2\pi\) radians, dispatchinganalysis.eigen.set-mode-3d-phaseoranalysis.frequency-domain.set-3d-phase) for visual spatial inspection;Complex projection mode (
real,imag,magnitude,phase_rotated_real), component selector, colormap, vectors, shader, volume clipping, and continuous phase playback rate selector (0.1 Hz,0.25 Hz,0.5 Hz,1 Hz,2 Hz) — explicitly noted as visual playback rates that never alter physical mode frequencies.
Additional Result & Diagnostic Inspectors
Live & Analysis Charts (
LiveChartInspectorPanel,ChartInspectorPanel,QuickChartInspectorPanel): Configure time/stage traces, horizontal axes, window decimation, and CSV exports.Materialized Datasets & Playback (
MaterializedDatasetInspectorPanel,SavedResultsPlaybackInspector): Browse paged scalar/table datasets and scrub saved frame timelines without reopening a solver backend.
Screenshots illustrate the interface; they are not runtime or physics qualification evidence.
Control Room crosswalk
Selection routes:
planar-monitor,planar-monitor-draft,eigen-dispersion,eigen-branch,eigen-dispersion-point,eigen-mode,frequency-response-sweep,frequency-response-point,fmr-peak,mode-visualization,chart,live-chart,materialized-dataset, andsaved-results-playback.State boundary: Monitor definitions commit authoring revisions (
MODEL_PLANAR_MONITORS_PATH); all frequency-domain and dataset inspectors areinspection-onlyresult views coupled to visualization state.
Python/API crosswalk
Planar monitors, eigenmode studies, Bloch \(k\)-paths, and driven frequency response sweeps are defined in
packages/fullmag-pystages and problem definitions.Phase rotation and 3D playback rate controls affect UI visualization state only and do not mutate Python study objects.
Physics and bibliography scope
This page documents inspection panels and complex-phasor visualization controls; generalized Bloch-periodic eigenvalue and linear-response susceptibility formulations are documented in the numerical-methods guide.
Source-code index
Responsibility |
Repository path |
Stable symbol |
|---|---|---|
Planar monitor draft creation |
|
|
Committed monitor editor |
|
|
Eigenmode dispersion summary inspector |
|
|
FMR frequency sweep inspector |
|
|
FMR resonance peak inspector |
|
|
3D eigenmode & response phase controls |
|
|
Saved results playback inspector |
|
|